Visualizing Twitch Viewer Ratings in D3js
- February 28, 2014
- visualization
- d3js starcraft visualization
- no comments
I made a visualization of the viewer ratings of the starcraft 2 channel TakeTV, you can see the result here. This post provides some background information on the data source and presentation of the data.
Data Source
The visualization displays the number of concurrent viewers of the popular Twitch channels taketv and wcs_europe_de. The number of concurrent viewers was determined once every minute using the Twitch API as explained here. The number of viewers are post processed by very light exponential smoothing.
The visualization lists broadcasts starting from January 1st 2014. It does neither cover all shows that happened since, nor is the data for a broadcast necessarily complete. The project is merely a result of me learning d3js, I’m in no way affiliated with TakeTV and only using their viewer counts for the lack of other interesting time series.
The visualization requires Javascript and SVG browser support.
Example
Here’s a screen capture for those without Javascript enabled:
Legend
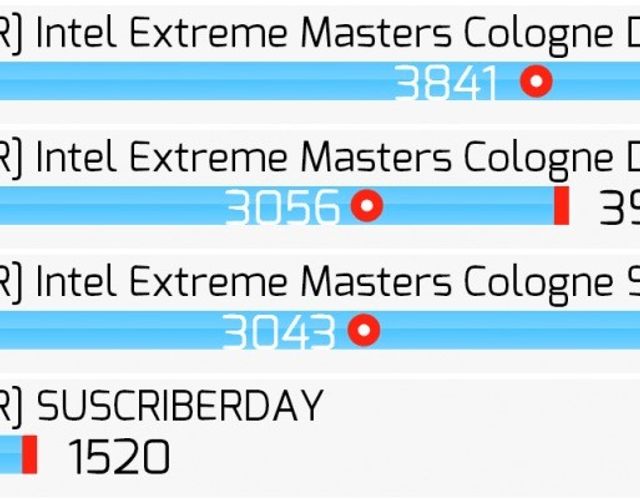
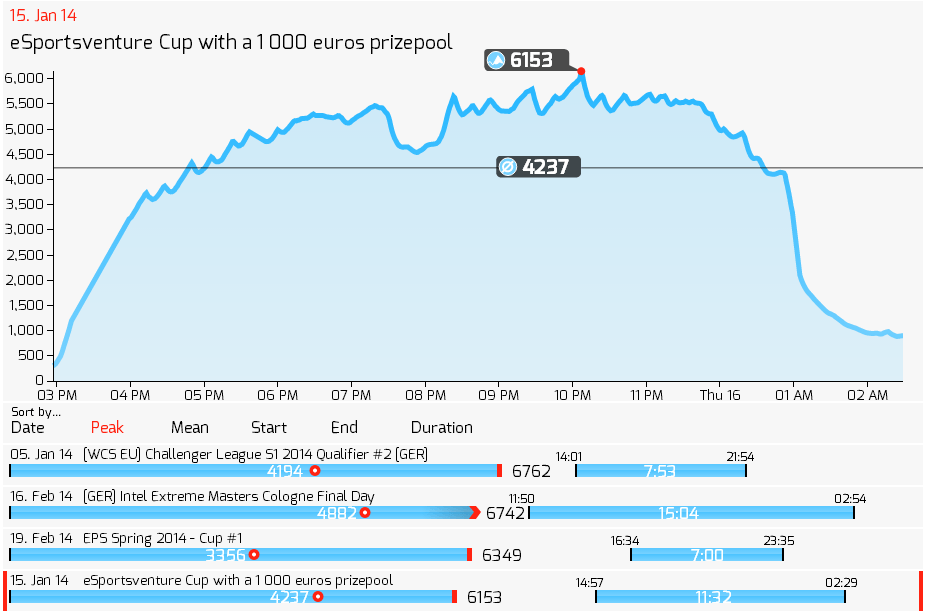
| chart item | description |
|---|---|
 | peak concurrent viewers |
 | mean concurrent viewers |
 | last update (for running broadcasts only). |
| table item | description |
 | date and title of broadcast; for broadcast spanning midnight the date is the start date; for broadcast with changing titles, the title is the one shown the longest |
 | currently selected broadcast; click a row to select and chart a broadcast |
 | Click text to sort by metric, click again to reverse order. Selected metric is shown in red. |
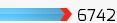
 | peak concurrent viewers; bar length reflects number |
 | peak concurrent viewers; bar length is shorter than actual viewers due to space constraints |
 | mean concurrent viewers; position of red-white dot reflects viewer count |
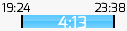 | start time, end time and duration of broadcast; bar length reflects duration of broadcast |
 | start time, end time and duration of broadcast; bar length is shorter than actual duration due to space constraints |
 | broadcast is in progress |